I wrote in a previous post that when selling covered calls, one of the criteria for deciding whether to sell the underlying stock is to determine whether it is underperforming the general market.
There are two ways to do that.
StockCharts.com
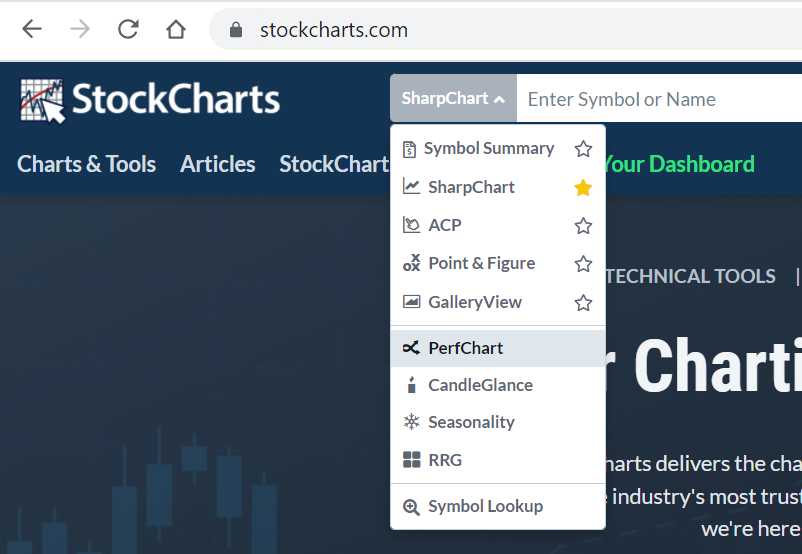
The first way is to use the “PerfChart” feature at stockcharts.com.
First, head over to the site and select “PerfChart”.
Next, enter $SPX for S&P500 and add the other tickers that you want to compare, separating them with commas. This results in a chart like the one below:
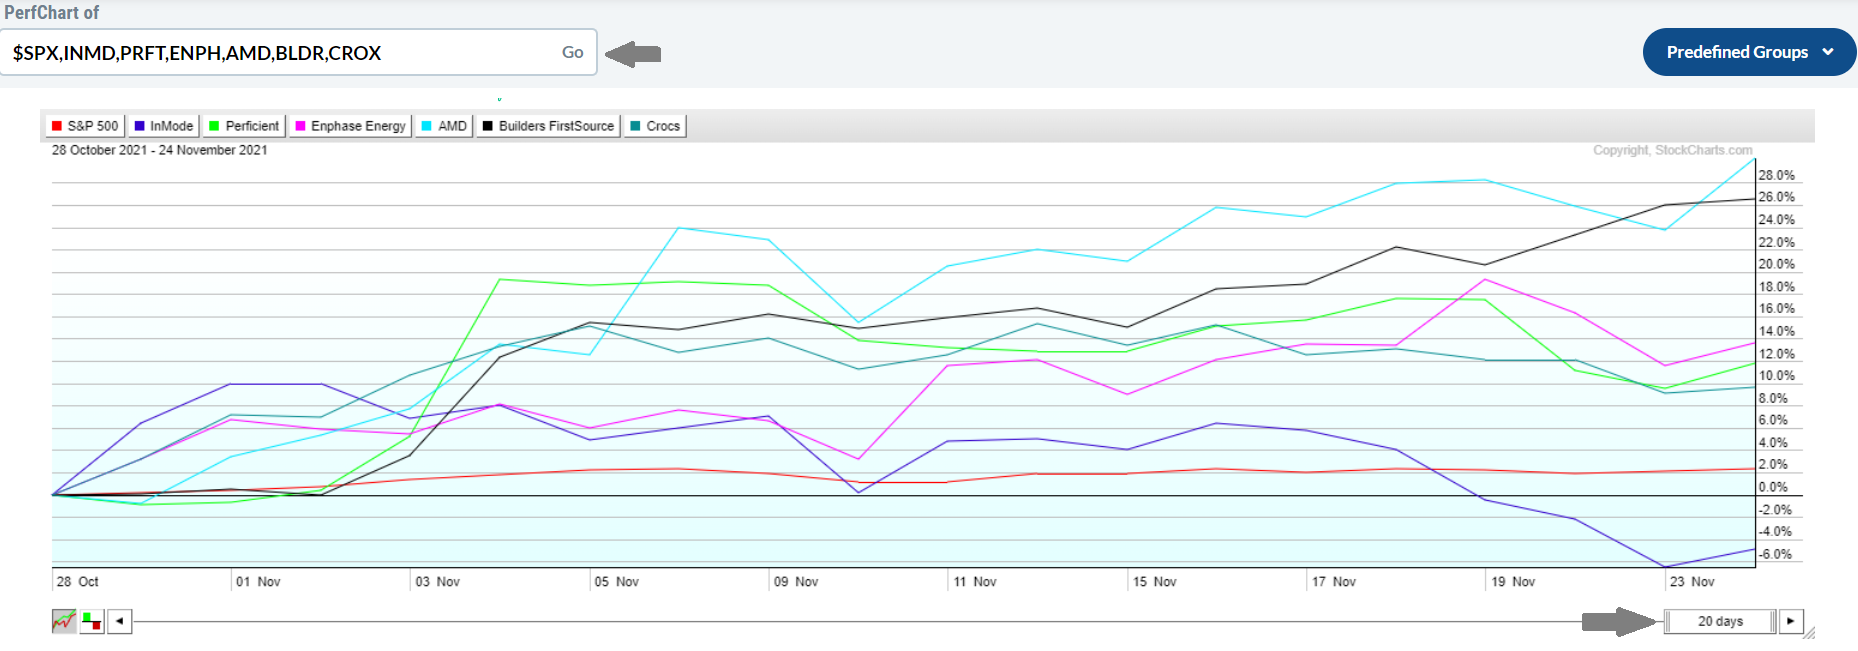
To change the number of days, click on the bar at the bottom right corner and edit it.
That’s it! From the chart above, we can see that most of the stocks have outperformed the S&P 500 (represented by the red line) in the last 20 days, except for INMD (represented in blue), which is underperforming by about 5%.
Python Code
If you do not want to use an online charting site to compare the stocks, you can do the same with Python. To do that, we use the normalize() method to normalize the price series and plot them on the same chart.

The code can be downloaded below:
Leave a Reply