Practiced on the weekly charts of 5 more stocks: DKS, NVDA, F, PLTR and AMZN. This time round, the results are not as outstanding.
Practice Records
DKS
| Week | Trade | Quantity | Entry | Stop Loss | Exit | Percentage Profit | |
| 8 Mar 10 | Buy | 1 | 25.52 | 22.08 | 26.28 | 22.09% | |
| 8 Nov 10 | Buy | 1 | 30.46 | 27.67 | 35.42 | 177.78% | |
| 7 Feb 11 | Buy | 1 | 38.47 | 35.42 | 39.07 | 19.67% | |
| 23 Apr 12 | Buy | 1 | 50.99 | 46.8 | 47.65 | -79.71% | |
| 23 Dec 13 | Buy | 1 | 57.62 | 54.01 | 55 | -72.58% | |
| 14 Jul 14 | Sell | 1 | 44.67 | 53.23 | 44.43 | 2.80% | |
| 14 Nov 16 | Buy | 1 | 60.76 | 54.35 | 54.35 | -100.00% | Stop loss was based on a recent low |
| 15 May 17 | Sell | 1 | 45.78 | 52.89 | 27.75 | 253.59% | |
| 11 Jan 21 | Buy | 1 | 64.84 | 51.14 | 66.85 | 14.67% | |
| 5 Apr 21 | Buy | 1 | 81.32 | 66.85 | 92.3 | 75.88% | |
| 26 Jul 21 | Buy | 1 | 104.94 | 91.48 | 119.43 | 107.65% |
NVDA
| Week | Trade | Quantity | Entry | Stop Loss | Exit | Percentage Profit | |
| 15 Feb 10 | Buy | 1 | 4.475 | 3.82 | 4.21 | -40.46% | |
| 28 Jun 10 | Sell | 1 | 2.675 | 3.38 | 2.65 | 3.55% | |
| 3 Jan 11 | Buy | 1 | 3.905 | 3.34 | 5.45 | 273.45% | |
| 8 Aug 11 | Sell | 1 | 3.1 | 4.07 | 3.71 | -62.89% | |
| 3 Oct 11 | Sell | 1 | 3.0725 | 3.71 | 3.71 | -100.00% | |
| 16 Sep 13 | Buy | 1 | 4.025 | 3.28 | 3.74 | -38.26% | |
| 30 Nov 15 | Buy | 1 | 8.035 | 6.21 | 7.85 | -10.14% | |
| 21 Mar 16 | Buy | 1 | 8.6125 | 6.51 | 8.66 | 2.26% | |
| 16 May 16 | Buy | 1 | 10.3 | 8.66 | 14.53 | 257.93% | |
| 26 Sep 16 | Buy | 1 | 16.41 | 14.53 | 25.92 | 505.85% | |
| 20 Mar 17 | Buy | 1 | 26.63 | 23.7925 | 35.51 | 312.95% | Stop loss was based on a recent low, almost stopped out |
| 17 Jul 17 | Buy | 1 | 41.675 | 35.51 | 47.79 | 99.19% | |
| 8 Jan 18 | Buy | 1 | 55.1 | 45.15 | 54 | -11.06% | |
| 19 Feb 18 | Buy | 1 | 62.7 | 54 | 55.46 | -83.22% | |
| 27 Aug 18 | Buy | 1 | 68.4025 | 58.31 | 59.68 | -86.43% | |
| 19 Nov 18 | Sell | 1 | 40.3025 | 62.47 | 37.58 | 12.28% | |
| 16 Dec 19 | Buy | 1 | 57.445 | 49.45 | 58.86 | 17.70% | |
| 13 Jul 20 | Buy | 1 | 106.802 | 86.86 | 127.5 | 103.79% | |
| 9 Nov 20 | Buy | 1 | 146.137 | 123 | 126.28 | -85.82% | Stop loss is based on a recent low |
| 15 Feb 21 | Buy | 1 | 153.163 | 125.86 | 129.03 | -88.39% | |
| 16 Aug 21 | Buy | 1 | 207.58 | 178.23 | 209.5 | 6.54% | |
| 18 Oct 21 | Buy | 1 | 219.56 | 195.55 | 287.78 | 284.13% | Stop loss was based on a recent low |
| 13 Jun 22 | Sell | 1 | 160 | 204 | 140.31 | 44.75% | Almost stopped out |
| 6 Mar 23 | Buy | 1 | 239.13 | 178.18 | 416.49 | 290.99% |
Ford
| Week | Trade | Quantity | Entry | Stop Loss | Exit | Percentage Profit | |
| 1 Mar 10 | Buy | 1 | 11.93 | 10.41 | 12.34 | 26.97% | |
| 11 Oct 10 | Buy | 1 | 13.77 | 11.64 | 16.6 | 132.86% | |
| 18 Jul 11 | Sell | 1 | 12.95 | 14.19 | 11.3 | 133.06% | |
| 21 Nov 11 | Sell | 1 | 10.02 | 11.3 | 11.3 | -100.00% | |
| 2 Jul 12 | Sell | 1 | 9.41 | 10.88 | 9.52 | -7.48% | |
| 24 Dec 12 | Buy | 1 | 11.91 | 10.65 | 12.76 | 67.46% | |
| 8 Jul 13 | Buy | 1 | 16.79 | 14.37 | 16.41 | -15.70% | |
| 21 Oct 13 | Buy | 1 | 17.6 | 16.21 | 16.53 | -76.98% | |
| 30 Jun 14 | Buy | 1 | 17.34 | 16.05 | 16.74 | -46.51% | |
| 15 May 17 | Sell | 1 | 10.85 | 11.8 | 11.54 | -72.63% | |
| 8 Jan 18 | Buy | 1 | 13.27 | 12.28 | 12.41 | -86.87% | |
| 23 Jul 18 | Sell | 1 | 10.46 | 12.05 | 9.44 | 64.15% | |
| 10 Dec 18 | Sell | 1 | 8.75 | 9.85 | 8.85 | -9.09% | |
| 6 Jul 20 | Sell | 1 | 5.75 | 7.74 | 6.87 | -56.28% | Stop loss was based on a recent high |
| 16 Nov 20 | Buy | 1 | 8.65 | 7.33 | 8.78 | 9.85% | |
| 18 Jan 21 | Buy | 1 | 10.25 | 8.78 | 11.72 | 100.00% | |
| 24 May 21 | Buy | 1 | 13.52 | 11.72 | 12.8 | -40.00% | |
| 3 Jan 22 | Buy | 1 | 21.54 | 17.07 | 20.1 | -32.21% | |
| 4 Jul 22 | Sell | 1 | 10.85 | 14.17 | 13.85 | -90.36% | |
| 30 Oct 23 | Sell | 1 | 9.85 | 12.7 | 10.64 | -27.72% |
WBD
| Week | Trade | Quantity | Entry | Stop Loss | Exit | Percentage Profit | |
| 22 Feb 10 | Buy | 1 | 16.606 | 14.1492 | 17.17 | 22.96% | Stop loss was based on a recent low |
| 31 Dec 12 | Buy | 1 | 33.0586 | 28.32 | 38.67 | 118.42% | |
| 12 May 14 | Sell | 1 | 36.8699 | 42.48 | 40.1 | -57.58% | |
| 10 Nov 14 | Sell | 1 | 31.93 | 38.9 | 35.73 | -54.52% | |
| 11 Sep 17 | Sell | 1 | 20.62 | 24.68 | 19.32 | 32.02% | |
| 4 Jan 21 | Buy | 1 | 30.43 | 26.72 | 50.12 | 530.73% | |
| 13 Sep 21 | Sell | 1 | 26.01 | 29.73 | 26.99 | -26.34% | |
| 13 Jun 22 | Sell | 1 | 14.77 | 20.08 | 15.13 | -6.78% | |
| 7 Nov 22 | Sell | 1 | 10.15 | 13.36 | 11.91 | -54.83% |
PLTR
| Week | Trade | Quantity | Entry | Stop Loss | Exit | Percentage Profit |
| 10 Jan 22 | Sell | 1 | 16.005 | 20.15 | 14.26 | 42.10% |
| 22 Aug 22 | Sell | 1 | 8.32 | 11.01 | 8.43 | -4.09% |
| 17 Jul 23 | Buy | 1 | 17.31 | 11.39 | 14.94 | -40.03% |
Profitability (Weekly vs Daily)
For weekly charts, the risk is 7.5% risk per trade. For daily chart, the risk is 5% per trade. Both use a starting balance of $100,000.
For daily charts, lot size is reduced by 0.1 unit if the previous two trades are losers and exit in less than 11 days. If the previous trade is a winner, lot size is increased by 0.1 unit, subject to a maximum of 1 unit.
Position sizing for weekly charts is similar, except that number of days to exit is not taken into consideration.
Entry strategy for daily charts:
- NVDA only used the EMA15 indicator
- PLTR only used the EMA15 indicator and a sector filter
- DKS used a sector filter and the EMA15, EMA50, EMA150 filter
- F and WBD only used the EMA15, EMA50, EMA150 filter
For weekly charts, only EMA10 and EMA30 are used so as to catch a trend earlier. I also focused on looking for Stage 2 and Stage 4 entries only.
| Balance and Max DD | DKS | NVDA | F | WBD | PLTR |
| Daily | $98,785.93, -19.37% | $444,114.22, -19.12% | $362,798.17, -18.77% | $265,298.53, -21.95% | $101,549.77, -25.04% |
| Weekly | $132,393.47, -17.61% | $265,238.29, -15.96% | $92,398.78, -25.11% | $136,337.33, -8.23% | $99,753.21, -3.30% |
Analysis
The results are quite mixed.
In general, trading on the weekly chart reduced the maximum drawdown quite significantly, except for Ford (F).
The results for Ford was most surprising. While it was the second most profitable stock on the daily chart, I ended with a loss when trading the weekly chart, with a higher maximum drawdown.
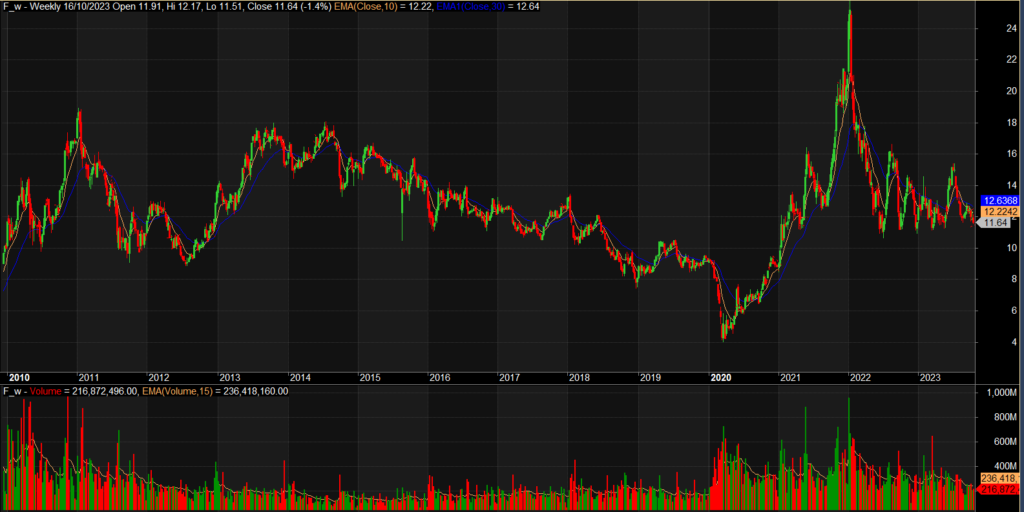
Was the weekly chart so different from the daily chart for F? I can’t say for sure. The image below shows the weekly chart for Ford from 2010 to end 2023. It does seem to trend in a broad channel, especially from 2014 to end 2019 and from mid 2022 to end 2023. Hence, a daily chart may be more suitable for capturing the movements within the channel.
Another possible reason for the poor performance could be that I was less stringent with my entry. I practiced on NVDA (weekly) before practicing on Ford. For NVDA, the performance on the weekly chart pales in comparison to the performance on the daily chart.
On the daily chart, I bagged a big 1837.25% winner. However, I missed this trade on the weekly chart (which would have resulted in a much smaller 273.45% winner).

The reason I missed this trade is because the moving averages had just crossed about 7 weeks ago and I was waiting for more confirmation. On hindsight, I could have taken into account the consecutive bullish trend bars before bar A and decided that it is ok to buy above bar A.
Due to missing out this trend, I started to be less strict with my entry, trying to catch a trend early so that I do not miss an entry. That contributed to the poor results for Ford in some ways. When it came to WBD, I decided to be a lot more stringent, which helped to reduce the maximum drawdown significantly.
Psychology really matters a lot in trading. I should constantly remind myself of the motto:
It’s not that most profitable trades have a good setup, but that most setups that are good end up being profitable trades.
Daily Vs Weekly
It is hard to decide whether I should switch to the weekly charts. Practicing on the weekly chart is much faster than on the daily chart, and I like that there are fewer trades, which helps to reduce the transaction costs. In addition, if I trade weekly charts in real life, I only need to work on the weekends to identify the trades. In contrast, if I trade on the daily charts, I need to scan for trades every day.
However, missing a good trade on a weekly chart is more costly, as good trades are fewer on a weekly chart (since there are less bars on a weekly chart). In addition, I will likely miss a lot of good trends that happen fast. For instance, a stock may move up significantly in one week, and be too extended by the end of the week to enter. Also, as the stop loss is further on a weekly chart, the profits from a winning trade may be significantly lower on the weekly chart. A good example is the NVDA trade mentioned above. On a daily chart, the percentage profit is 1837.25%; on a daily chart, it is only 273.45%.
All in all, I think sticking to a daily chart makes more sense, but I need to be more stringent in my entry to reduce the drawdown. I expect that there should be more Stage 2 and 4 trades on a daily chart, so I can afford to be more picky?
Sidenote
One issue with my current exit strategy is that sometimes I get hit with a 100% loss because the stop loss is very close to the entry price. Perhaps I should consider setting a minimum initial stop loss? However, that may also reduce the chance of me getting a massive winner.
Leave a Reply