Haven’t posted for some time. After practicing on the weekly charts last week, I went back to practice on Ford’s daily chart again.
Given the drastic difference between the profitability on the daily vs weekly charts, I wonder if the difference is because my chart reading skills have deteriorated. Fortunately, my results for the second practice session for Ford’s daily chart is similar to the previous practice session. Hence, the difference is truly because the characteristics of the two charts.
Next, I spent some time practicing on Apple’s (AAPL) daily chart. Here are the results:
Practice Date: 16 Jan 24
| Date | Trade | Quantity | Entry | Indicator SL | Actual SL | Exit | Percentage Profit | Remarks |
| 24 Mar 10 | Buy | 1 | 8.21156355 | 7.87 | 7.87 | 9.03679 | 241.60% | |
| 6 Oct 10 | Buy | 1 | 10.3891875 | 9.82 | 9.82 | 11.02 | 110.83% | |
| 26 Nov 10 | Buy | 1 | 11.3206215 | 10.88 | 10.88 | 11.39 | 15.75% | |
| 4 Jan 11 | Buy | 1 | 11.853975 | 11.48 | 11.48 | 12.12 | 71.13% | |
| 7 Feb 11 | Buy | 1 | 12.4440105 | 11.94 | 11.94 | 12.63 | 36.90% | |
| 18 Jan 12 | Buy | 1 | 15.2899695 | 14.97 | 14.83127042 | 17.45 | 470.90% | |
| 22 Feb 12 | Buy | 1 | 18.4794375 | 17.45 | 17.45 | 18.78 | 29.20% | |
| 14 Aug 12 | Buy | 1 | 22.6125 | 21.97 | 21.934125 | 23.73 | 164.73% | |
| 14 Sep 12 | Buy | 1 | 24.6414 | 23.73 | 23.73 | 24.5307 | -12.15% | |
| 15 Jan 13 | Sell | 1 | 17.7148805 | 19 | 19 | 16.52 | 92.98% | |
| 18 Apr 13 | Sell | 1 | 14.147109 | 15.64 | 15.64 | 15.02 | -58.47% | |
| 27 Nov 13 | Buy | 1 | 19.2436395 | 18.46 | 18.46 | 19.98 | 93.97% | |
| 6 May 14 | Buy | 1 | 21.5716215 | 20.45 | 20.45 | 20.8764 | -61.98% | Stopped out by 22 cents, stock resumed uptrend |
| 23 May 14 | Buy | 1 | 21.798852 | 20.98 | 20.98 | 22.94 | 139.36% | |
| 8 Jul 14 | Buy | 1 | 24.1174875 | 23.02 | 23.02 | 23.38 | -67.20% | |
| 28 Jul 14 | Buy | 1 | 24.59235 | 23.14 | 23.14 | 24.16 | -29.77% | |
| 13 Nov 14 | Buy | 1 | 27.9967875 | 26.95 | 26.95 | 29.16 | 111.12% | |
| 11 Feb 15 | Buy | 1 | 30.6925 | 29.58 | 29.58 | 32.01 | 118.43% | |
| 12 Aug 15 | Sell | 1 | 28.1908375 | 29.545 | 29.545 | 28.0575 | 9.85% | |
| 31 Dec 15 | Sell | 1 | 26.3202375 | 28.85 | 28.85 | 25.12 | 47.44% |
Practice Date: 17 Jan 24
| Date | Trade | Quantity | Entry | Indicator SL | Actual SL | Exit | Percentage Profit | Remarks |
| 28 Jan 16 | Sell | 1 | 23.218325 | 25.12 | 25.12 | 24.23 | -53.20% | |
| 11 Oct 16 | Buy | 1 | 29.425 | 28.16 | 28.16 | 28.93 | -39.13% | |
| 9 Jan 17 | Buy | 1 | 29.6877 | 28.9 | 28.797069 | 34.65 | 557.17% | |
| 20 Mar 17 | Buy | 1 | 35.3634375 | 34.26 | 34.26 | 34.93 | -39.28% | |
| 4 Apr 17 | Buy | 1 | 36.19005 | 34.93 | 34.93 | 35.79 | -31.75% | |
| 2 May 17 | Buy | 1 | 36.984 | 35.79 | 35.79 | 38.08 | 91.79% | |
| 25 Jul 17 | Buy | 1 | 38.30055 | 37.17 | 37.1515335 | 37.22 | -94.04% | |
| 30 Oct 17 | Buy | 1 | 41.1045 | 38.76 | 38.76 | 42.93 | 77.86% | |
| 22 Nov 17 | Buy | 1 | 43.642125 | 42.1 | 42.1 | 42.69 | -61.74% | |
| 15 Dec 17 | Buy | 1 | 43.441125 | 41.79 | 41.79 | 42.7 | -44.89% | Stock gapped down |
| 5 Feb 18 | Sell | 1 | 39.775 | 42.54 | 42.54 | 40.93 | -41.77% | |
| 4 Jun 18 | Buy | 1 | 47.91 | 46.55 | 46.4727 | 47.84 | -4.87% | |
| 13 Sep 18 | Buy | 1 | 56.355375 | 54.1175 | 54.1175 | 54.14 | -98.99% | Stop loss was based on a recent low |
| 22 Mar 19 | Buy | 1 | 49.3279125 | 45.94 | 45.94 | 46.18 | -92.92% | Stopped out by a 3.5 cents, stock resumed upmove |
| 18 Apr 19 | Buy | 1 | 51.099225 | 49.08 | 49.08 | 50.58 | -25.71% | |
| 29 Jul 19 | Buy | 1 | 52.4886375 | 50.55 | 50.55 | 51.3825 | -57.06% | Stock gapped down |
| 22 Oct 19 | Buy | 1 | 60.5487375 | 58.08 | 58.08 | 60.45 | -4.00% | |
| 1 Nov 19 | Buy | 1 | 62.6039625 | 59.315 | 59.315 | 65.53 | 88.97% | Stop loss was based on bar low |
| 26 Nov 19 | Buy | 1 | 66.94305 | 65.53 | 64.9347585 | 64.5775 | -117.79% | Stock gapped down |
| 16 Dec 19 | Buy | 1 | 69.25 | 66.23 | 66.23 | 77.515 | 273.68% | Stock gapped down |
| 29 Jan 20 | Buy | 1 | 81.1125 | 76.22 | 76.22 | 76.22 | -100.00% | Stop loss was based on a recent low |
| 19 May 20 | Buy | 1 | 79.520625 | 75.49 | 75.49 | 94.09 | 361.47% | |
| 21 Jul 20 | Buy | 1 | 98.9925 | 93.88 | 93.88 | 95.84 | -61.66% | |
| 19 Aug 20 | Buy | 1 | 116.623215 | 108.9 | 108.9 | 124.58 | 103.02% | |
| 1 Dec 20 | Buy | 1 | 121.57485 | 112.59 | 112.59 | 120.89 | -7.62% | Stop loss was based on a recent low |
| 17 Dec 20 | Buy | 1 | 128.5395 | 120.89 | 120.89 | 124.13 | -57.64% | Stopped out by a 68 cents, stock resumed upmove |
| 28 Dec 20 | Buy | 1 | 135.08205 | 124.13 | 124.13 | 131.1 | -36.36% | |
| 22 Jul 21 | Buy | 1 | 147.8355 | 141.67 | 141.67 | 144.63 | -51.99% | Stop loss was based on a recent low |
| 16 Aug 21 | Buy | 1 | 149.79525 | 145.18 | 145.18 | 145.03 | -103.25% | Stock gapped down, resumed uptrend |
| 1 Sep 21 | Buy | 1 | 154.25745 | 146.78 | 146.78 | 153.09 | -15.61% | |
| 18 Nov 21 | Buy | 1 | 155.775 | 149.82 | 149.82 | 156.53 | 12.68% | Stopped out by 17 cents, stock resumed uptrend |
| 1 Dec 21 | Buy | 1 | 167.48 | 156.53 | 156.53 | 170.7 | 29.41% | |
| 25 Apr 22 | Sell | 1 | 160.6925 | 171.27 | 171.27 | 147.36 | 126.05% | |
| 3 Feb 23 | Buy | 1 | 151.9359 | 141.9 | 141.9 | 149.22 | -27.06% | |
| 28 Apr 23 | Buy | 1 | 169.4028 | 164.03 | 164.03 | 164.89 | -83.99% | |
| 19 May 23 | Buy | 1 | 176.1162 | 170.76 | 170.76 | 170.76 | -100.00% | Stopped out by 24 cents, stock resumed uptrend |
| 26 Jun 23 | Buy | 1 | 187.98525 | 182.02 | 182.02 | 188.94 | 16.01% | |
| 19 Jul 23 | Buy | 1 | 195.2916 | 186.6 | 186.6 | 191.81 | -40.06% | |
| 8 Dec 23 | Buy | 1 | 195.372 | 188.57 | 188.57 | 191.72 | -53.69% |
Profitability
Using an initial balance of $100,000, 5% risk per trade and strategy 4 for position sizing (ignoring number of days to exit as I was lazy to compute it), the final balance is $207,155.09 with a maximum drawdown of -16.20%.
Analysis
The above result is quite disappointing as Apple went from a starting price of about $7.5 in 2010 to a final price of $185.92 in end 2023, an increase of almost 25 times. Using a 5% risk per trade, I only managed to double the final balance.
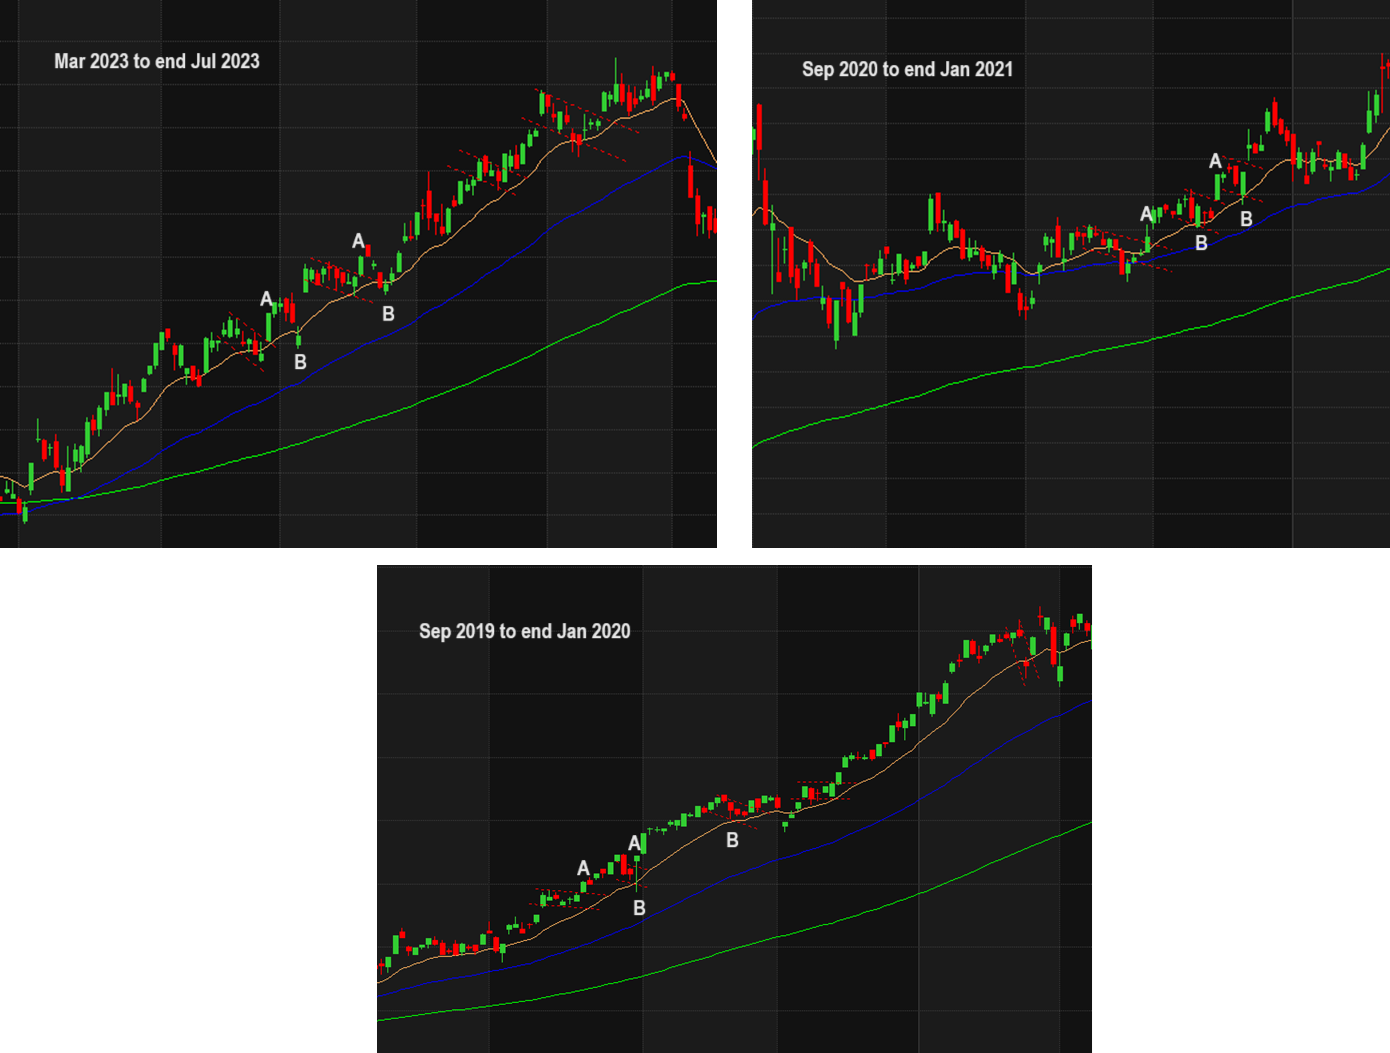
The first practice session for AAPL covered the years from 2010 to end 2015; this practice session was quite profitable and I managed to catch a few good trends. In contrast, the second practice session that covered the years from 2016 to end 2023 was filled with frustrations. There were multiple times when I was stopped out by a few cents, only for the trend to resume. This happened at least 6 times, for trades that were entered on the following dates:
- 6 May 14
- 22 Mar 19
- 17 Dec 20
- 16 Aug 21
- 18 Nov 21
- 19 May 23
The following image shows a few of the examples. Each time, I entered above candle A and was stopped out at candle B:
Altering the Trailing Stop
In light of the above, I decided to test out two new stop loss strategies.
The first strategy is to use a ATR trailing stop. I used a 14 period ATR, with a multiple of 2.5 times. In addition, I exit based on the close, instead of the high or low. For instance, for buy orders, I exit only when the close is below the trailing stop, instead of the low being below it. The only exception is when the low dips below the initial stop loss.
With this exit strategy, I managed to reduce the number of trades from 59 to 39 and increase the final balance to $239,899.32. However, somewhat surprisingly, the maximum drawdown also increased to -23.60%.
Next, I tried a second strategy. This strategy is similar to the strategy that I have always being using, the main difference is that I exit based on the close, instead of the high or low. In addition, similar to the ATR exit strategy tested above, I exit if prices breach the initial stop loss.
With this second exit strategy, the results improved A LOT; I increased the final balance to $449,322.75, and reduced the maximum drawdown to -14.91%. I also reduced the number of trades from 59 to 45.
This is definitely encouraging. However, the exit strategy may work so well mainly because I was stopped out by a small amount quite a few times for AAPL. For other stocks, the improvement may not hold.
Will need to test this further. For the next stock, I’ll exit using the close, instead of the high or low.
Next Steps
Next, I’ll practice on META. I may also repeat the practice on MU and SWN, using the new entry and exit strategies.
Summary of Current Strategy
Entry Criteria
One of the key difference in terms of my entry strategy now is I use 3 moving averages (EMA 15, EMA 50 and EMA 150); I try to enter when the three EMAs are in the correct order and sloping correctly.
In addition, I focus on trying to identify the stage that the stock is in. Ideally, I want to enter in Stage 2 and 4. Stage 2 and 4 can start with moving average crossovers, or when a support/resistance/trendline is broken.
Entry is done with a buffer of 0.5%. In other words, for buy orders, enter 0.5% above the high of the signal bar. For sell orders, enter 0.5% below the low.
Caution
A lot of times, it is difficult to determine which stage a stock is in. When in doubt, the best is to stay out.
Also, it is harder to sell than to buy, as bearish actions are normally fast and furious and tend to be choppy. I tell myself that it is ok to avoid selling unless I am certain it is a Stage 4 trade and price action is relatively calm.
Last but not least, I try not to buy after the third pullback. For sell orders, I may not enter if price has already had a significant fall (e.g., a large bear candle, a big gap down). Bear trends tend to end faster.
Exit Criteria
For exit strategy, I’ll exit using the close instead of the high and low (except when prices breach the initial stop loss).
I’ll be very happy if I can improve on the previous MU and SWN results, either in terms of the final balance, or the maximum drawdown.
Leave a Reply