In today’s post, let’s explore the topic: Do candlestick patterns work in Forex?
Before we begin, let’s do a quick introduction to candlestick patterns.
I believe most readers of a trading blog should understand and be able to read a candlestick chart, so I will not go into the basics. In the rare event that you are not familiar with candlesticks, you can find countless introductory videos on YouTube, here is a good one https://www.youtube.com/shorts/dXi97O2kc-8
In today’s post, we will be presenting backtested data and statistics on candlestick patterns in an attempt to answer the question “Do candlestick patterns work in Forex”?
What are candlestick patterns
But first off, what are candlestick patterns?
Candlestick patterns are formations created by one or more candlesticks that represent price action over a specific period. Analysing these candlestick patterns can help us better understand the underlying market sentiment, allowing us to detect trend continuation or reversals early.
The roots of candlestick analysis go back more than 300 years, long before Forex trading even existed. The method was developed in Japan by Munehisa Homma, a legendary rice trader from the 18th century who noticed that market prices were heavily influenced by human emotion – fear and greed – as much as by supply and demand. Homma’s meticulous observation of market psychology helped him identify recurring price behaviours, which later evolved into what we now call candlestick patterns.
Candlestick pattern analysis was introduced to the western world by Steve Nison, an American technical analyst who introduced these concepts to Western traders through his groundbreaking 1991 book, Japanese Candlestick Charting Techniques. Nison’s work transformed how traders viewed price data, bridging the gap between Eastern charting wisdom and Western technical analysis. Today, candlestick charts are a standard feature across all trading platforms – including Forex, stocks, and crypto.
The Psychology Behind Candlestick Patterns
There are dozens of known candlestick patterns, but some of the most popular ones include the Doji, Hammer, Engulfing, and Shooting Star.
Each tells a unique story about the battle between buyers and sellers.
For instance, let’s consider a bullish candlestick pattern called the hammer. This pattern, when spotted after a downtrend, signals bullishness and a possible reversal.
A hammer is a candle whose real body is near the top of the candle, and whose tail (or lower wick) is at least 2 to 3 times its real body.
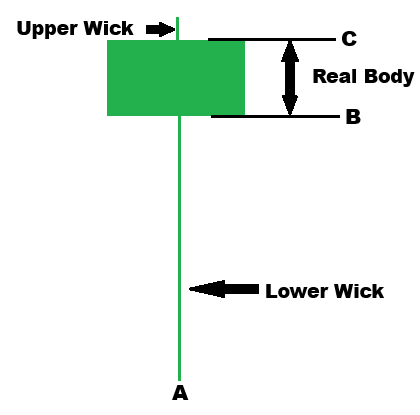
Figure 1: Hammer
To understand why this pattern is meaningful, let’s consider what happened over the course of the trading day (assuming this is a daily candle). At one point, the market was very bearish and pushed prices all the way down to the low of the candle.
In Figure 1 above, imagine how the bears felt when prices reached point A. Probably exhilarated, right? Unfortunately, this joy did not last.
Soon the bulls came out in full force and pushed prices all the way back up. Given the long tail, it does take a significant amount of effort to push prices back to point B. It does not matter whether the day closed positive or negative, although understandably, finishing positive will be even more bullish.
What matters is that the bulls managed to reverse the bearishness and made good progress in pushing price up. It shows willingness and commitment on the bull’s part. Hence, a hammer appearing after a downtrend may very well signify the start of a bullish trend.
An Experiment: Do candlestick patterns work in Forex?
To determine if candlestick patterns work in Forex, I’ve decided to put different candlestick patterns to the test.
Specifically, I will be presenting data on 6 different candlestick patterns – bullish engulfing, bullish harami, hammer, bearish engulfing, bearish harami, and shooting star.
The first three are bullish patterns while the last three are bearish patterns.
For each pattern, I’ll compute the percentage profit (or loss) after 1 day, 5 days, 10 days and 20 days and compare the gains with signals taken at random.
Each pattern is tested on 7 Forex pairs – EURUSD, GBPUSD, AUDUSD, NZDUSD, USDJPY, USDCHF and USDCAD. Daily Forex data (provided by Norgate data) from 1 Jan 1999 to 31 Oct 2025 was used.
Forex Candlestick Pattern Definitions
Let’s define the 6 patterns. Here are some notations to be familiar with for the candlestick pattern definitions:
- High(Tmr) = Tomorrow’s high
- Low(Tmr) = Tomorrow’s low
- Open(Today) = Today’s open
- High(Today) = Today’s high
- Low(Today) = Today’s low
- Close(Today) = Today’s close
- Bottom(Today) = The bottom of the real body of today’s candle (Point B in Figure 1)
- Top(Today) = The top of the real body of today’s candle (Point A in Figure 1)
- Open(Ytd) = Yesterday’s open
- High(Ytd) = Yesterday’s high
- Low(Ytd) = Yesterday’s low
- Close(Ytd) = Yesterday’s close
- Slope(Low, 10) = Linear regression slope of the past 10 days’ low
- Slope(High, 10) = Linear regression slope of the past 10 days’ high
- ATR = Average True Range
The real body of a candle refers to the rectangle formed by the open and close prices. Typically, the real body is green if the close is greater than the open (i.e. the candle represents an up day) and red if the reverse is true. Some charting software may use a hollow candle to represent an up day and a solid one to represent a down day instead.
Resistance refers to either the upper Bollinger band, a horizontal level formed by the high of a candle (defined below) or a pivot point calculated based on the previous week’s high, low and close.
Support refers to either the lower Bollinger band, a horizontal level formed by the low of a candle (defined below) or a pivot point calculated based on the previous week’s high, low and close.
Bollinger bands are computed using the 20 days moving average and 2 standard deviations. A valid signal occurs only when the Bollinger band width is at least 2%.
Horizontal levels refer to resistance or support levels that have not been breached n days before and m days after. For the purpose of this study, a resistance is formed when the high of a candle is the highest for the past 10 days and the next 5 days. A support is formed when the low of the candle is the lowest for the past 10 days and the next 5 days.
As we need to look 5 days ahead when determining support and resistance levels, only levels that are formed more than 5 days prior to the current candle are considered valid.
A pivot point is a price level used by traders to predict potential turning points in financial markets. It is calculated using the candle’s high, low and close. There is a total of 7 pivot points. The central pivot point P serves as the primary reference level. From there, three support (S1, S2, S3) and resistance (R1, R2, R3) levels are derived. The formulas are as follow:
- P = (H + L + C) / 3
- R1 = P + (P − L) = 2×P − L
- S1 = P − (H − P) = 2×P – H
- R2 = P + (H − L)
- S2 = P − (H − L)
- R3 = H + 2×(P − L) = R1 + (H − L)
- S3 = L − 2×(H − P) = S1 − (H − L)
All definitions are based on the description given in the book “The Candlestick Course” by Steve Nison. Some definitions have to be quantified in order to be tested systematically. For instance, a large candle is defined as a candle whose real body has a height that is at least one ATR.
Visual Overview of the Six Candlestick Patterns
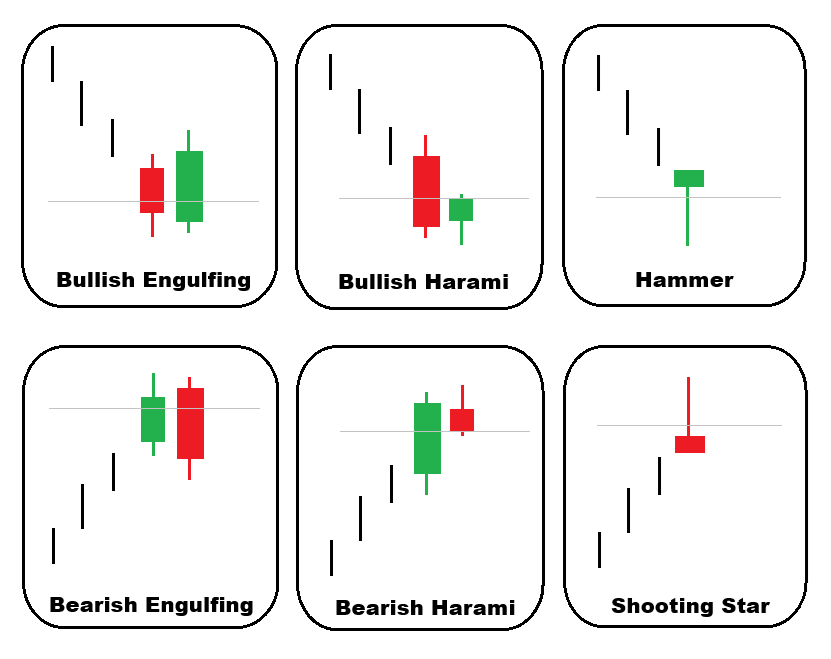
Bullish Engulfing
A bullish engulfing candlestick pattern occurs when yesterday was a down day (1) and today is an up day (2).
In addition, today’s candle’s real body should engulf the real body of the previous candle (3 and 4). Ideally, we would like today’s candle to open below yesterday’s close, resulting in a gap down at the open. However, since I’m interested in whether candlestick patterns work in Forex, and the Forex market trades 24 hours a day, gaps are a lot less frequent. Therefore, I’ve allowed for today’s candle to open at or below yesterday’s close.
To avoid candles that are of insignificant sizes, a bullish engulfing candle’s real body should have a height of at least one ATR. (5)
In addition, the candle should also be at a support level. In other words, the support level should fall within the range of today’s candle. (6)
Next, a bullish engulfing pattern should come after a downtrend. For the purpose of this study, a trend is identified using the slope of the linear regression line for the past 10 days’ prices.
If the slope of the line using the lows of the past 10 days is negative, the trend is down. (7)
Last but not least, a signal is valid only if prices break above the high of the bullish engulfing candle by at least one pip the next day. (8)
The quantified rules are as follow:
- Close(Ytd) < Open(Ytd)
- Close(Today) > Open(Today)
- Open(Today) <= Close(Ytd)
- Close(Today) > Open(Ytd)
- Close(Today) – Open(Today) > one ATR
- Low(Today) <= Support <= High(Today)
- Slope(Low, 10) < 0
- High(Tmr) >= High(Today) + 1 pip
Bullish Harami
A bullish harami candlestick pattern is like the reverse of a bullish engulfing pattern. Instead of requiring the current candle’s real body to engulf the previous candle’s real body, we want it to be entirely within the previous candle’s real body.
To identify a bullish harami pattern, we first look for a large bearish candle where the real body has a height of at least one ATR. (1)
The next candle should be a small candle (can be bullish or bearish) with a real body that is at most 0.5 ATR. (2)
The small candle’s real body must be completely within the previous candle’s real body. (3 and 4) As before, since we are exploring whether candlestick patterns work in Forex and gaps are not common, we accept cases where the bottom of the current candle’s real body is equal to the previous candle’s close.
Next, the previous candle (of which the current candle is entirely within) should be at a support level. (5)
Other than the above criteria, the remaining two criteria are the same as for the bullish engulfing candlestick pattern.
Here are the specific rules:
- Open(Ytd) – Close(Ytd) > one ATR
- Top(Today) – Bottom(Today) < 0.5 ATR
- Top(Today) < Open(Ytd)
- Bottom(Today) >= Close(Ytd)
- Low(Ytd) <= Support <= High(Ytd)
- Slope(Low, 10) < 0
- High(Tmr) >= High(Today) + 1 pip
Hammer
Next, we have the hammer pattern.
A hammer has a long lower tail that is at least twice the height of the real body. (1)
In addition, the candle’s real body should be near the top of the candle. We define this as the upper wick being at most 10% of the candle’s entire height (including the wicks). (2)
Once again, to prevent identifying candles with insignificant sizes, we require the height of the candle (including the wicks) to be at least one ATR. (3)
Other than the above criteria, the last 3 criteria are the same as for the bullish engulfing candlestick pattern.
Here are the rules for the hammer candlestick pattern:
- Bottom(Today) – Low(Today) > 2*[Top(Today) – Bottom(Today)]
- High(Today) – Top(Today) < 0.1*[High(Today) – Low(Today)]
- High(Today) – Low(Today) > one ATR
- Low(Today) <= Support <= High(Today)
- Slope(Low, 10) < 0
- High(Tmr) >= High(Today) + 1 pip
Bearish Engulfing
A bearish engulfing candlestick pattern is the bearish equivalent of the bullish engulfing pattern. Since we are already familiar with the bullish engulfing candlestick pattern, I will not elaborate on the bearish version.
Rather, I will just present the rules as follow:
- Close(Ytd) > Open(Ytd)
- Close(Today) < Open(Today)
- Open(Today) >= Close(Ytd)
- Close(Today) < Open(Ytd)
- Open(Today) – Close(Today) > one ATR
- Slope(High, 10) > 0
- Low(Today) <= Resistance <= High(Today)
- Low(Tmr) <= Low(Today) – 1 pip
Bearish Harami
Next, we have the bearish harami candlestick pattern, which is the bearish equivalent of the bullish harami pattern. The rules are as follow:
- Close(Ytd) – Open(Ytd) > one ATR
- Top(Today) – Bottom(Today) < 0.5 ATR
- Top(Today) <= Close(Ytd)
- Bottom(Today) > Open(Ytd)
- Slope(High, 10) > 0
- Low(Ytd) <= Resistance <= High(Ytd)
- Low(Tmr) <= Low(Today) – 1 pip
Shooting Star
Finally, we have the shooting star pattern, which is the bearish equivalent of the hammer pattern. The rules are:
- High(Today) – Top(Today) > 2*[Top(Today) – Bottom(Today)]
- Bottom(Today) – Low(Today) < 0.1*[High(Today) – Low(Today)]
- High(Today) – Low(Today) > one ATR
- Slope(High, 10) > 0
- Low(Today) <= Resistance <= High(Today)
- Low(Tmr) <= Low(Today) – 1 pip
Results
Suppose entry is on Day 1.
Bullish entries occur one pip above the previous day’s high while bearish entries occur one pip below the previous day’s low.
G1, G5, G10 and G20 refers to the mean percentage gain if the trade is exited at the close of Day 1, 5, 10 and 20 respectively.
S refers to the sample size of each category.
Using Bollinger Bands
| G1 | G5 | G10 | G20 | ||
| Bullish Engulfing S = 58 | Candlestick Pattern | 0.0257 | 0.143 | 0.0296 | -0.2641 |
| Random Signal | 0.009 | -0.0294 | 0.2863 | 0.3621 | |
| Bullish Harami S = 105 | Candlestick Pattern | -0.1358 | -0.0959 | -0.1243 | -0.4154 |
| Random Signal | 0.009 | -0.0294 | 0.2863 | 0.3621 | |
| Hammer S = 60 | Candlestick Pattern | 0.0504 | -0.034 | 0.2584 | 0.1461 |
| Random Signal | 0.009 | -0.0294 | 0.2863 | 0.3621 | |
| Bearish Engulfing S = 67 | Candlestick Pattern | -0.0453 | -0.0713 | -0.1205 | -0.0456 |
| Random Signal | 0.0267 | 0.0644 | -0.0666 | -0.122 | |
| Bearish Harami S =117 | Candlestick Pattern | 0.0356 | 0.3019 | 0.1057 | -0.0862 |
| Random Signal | 0.0267 | 0.0644 | -0.0666 | -0.122 | |
| Shooting Star S = 74 | Candlestick Pattern | 0.0286 | 0.1798 | 0.2311 | 0.3373 |
| Random Signal | 0.0267 | 0.0644 | -0.0666 | -0.122 | |
| Bullish Patterns S = 222 | Candlestick Pattern | -0.0485 | -0.0006 | 0.0182 | -0.2418 |
| Random Signal | 0.009 | -0.0294 | 0.2863 | 0.3621 | |
| Bearish Patterns S = 257 | Candlestick Pattern | 0.0138 | 0.1743 | 0.0877 | 0.0507 |
| Random Signal | 0.0267 | 0.0644 | -0.0666 | -0.122 |
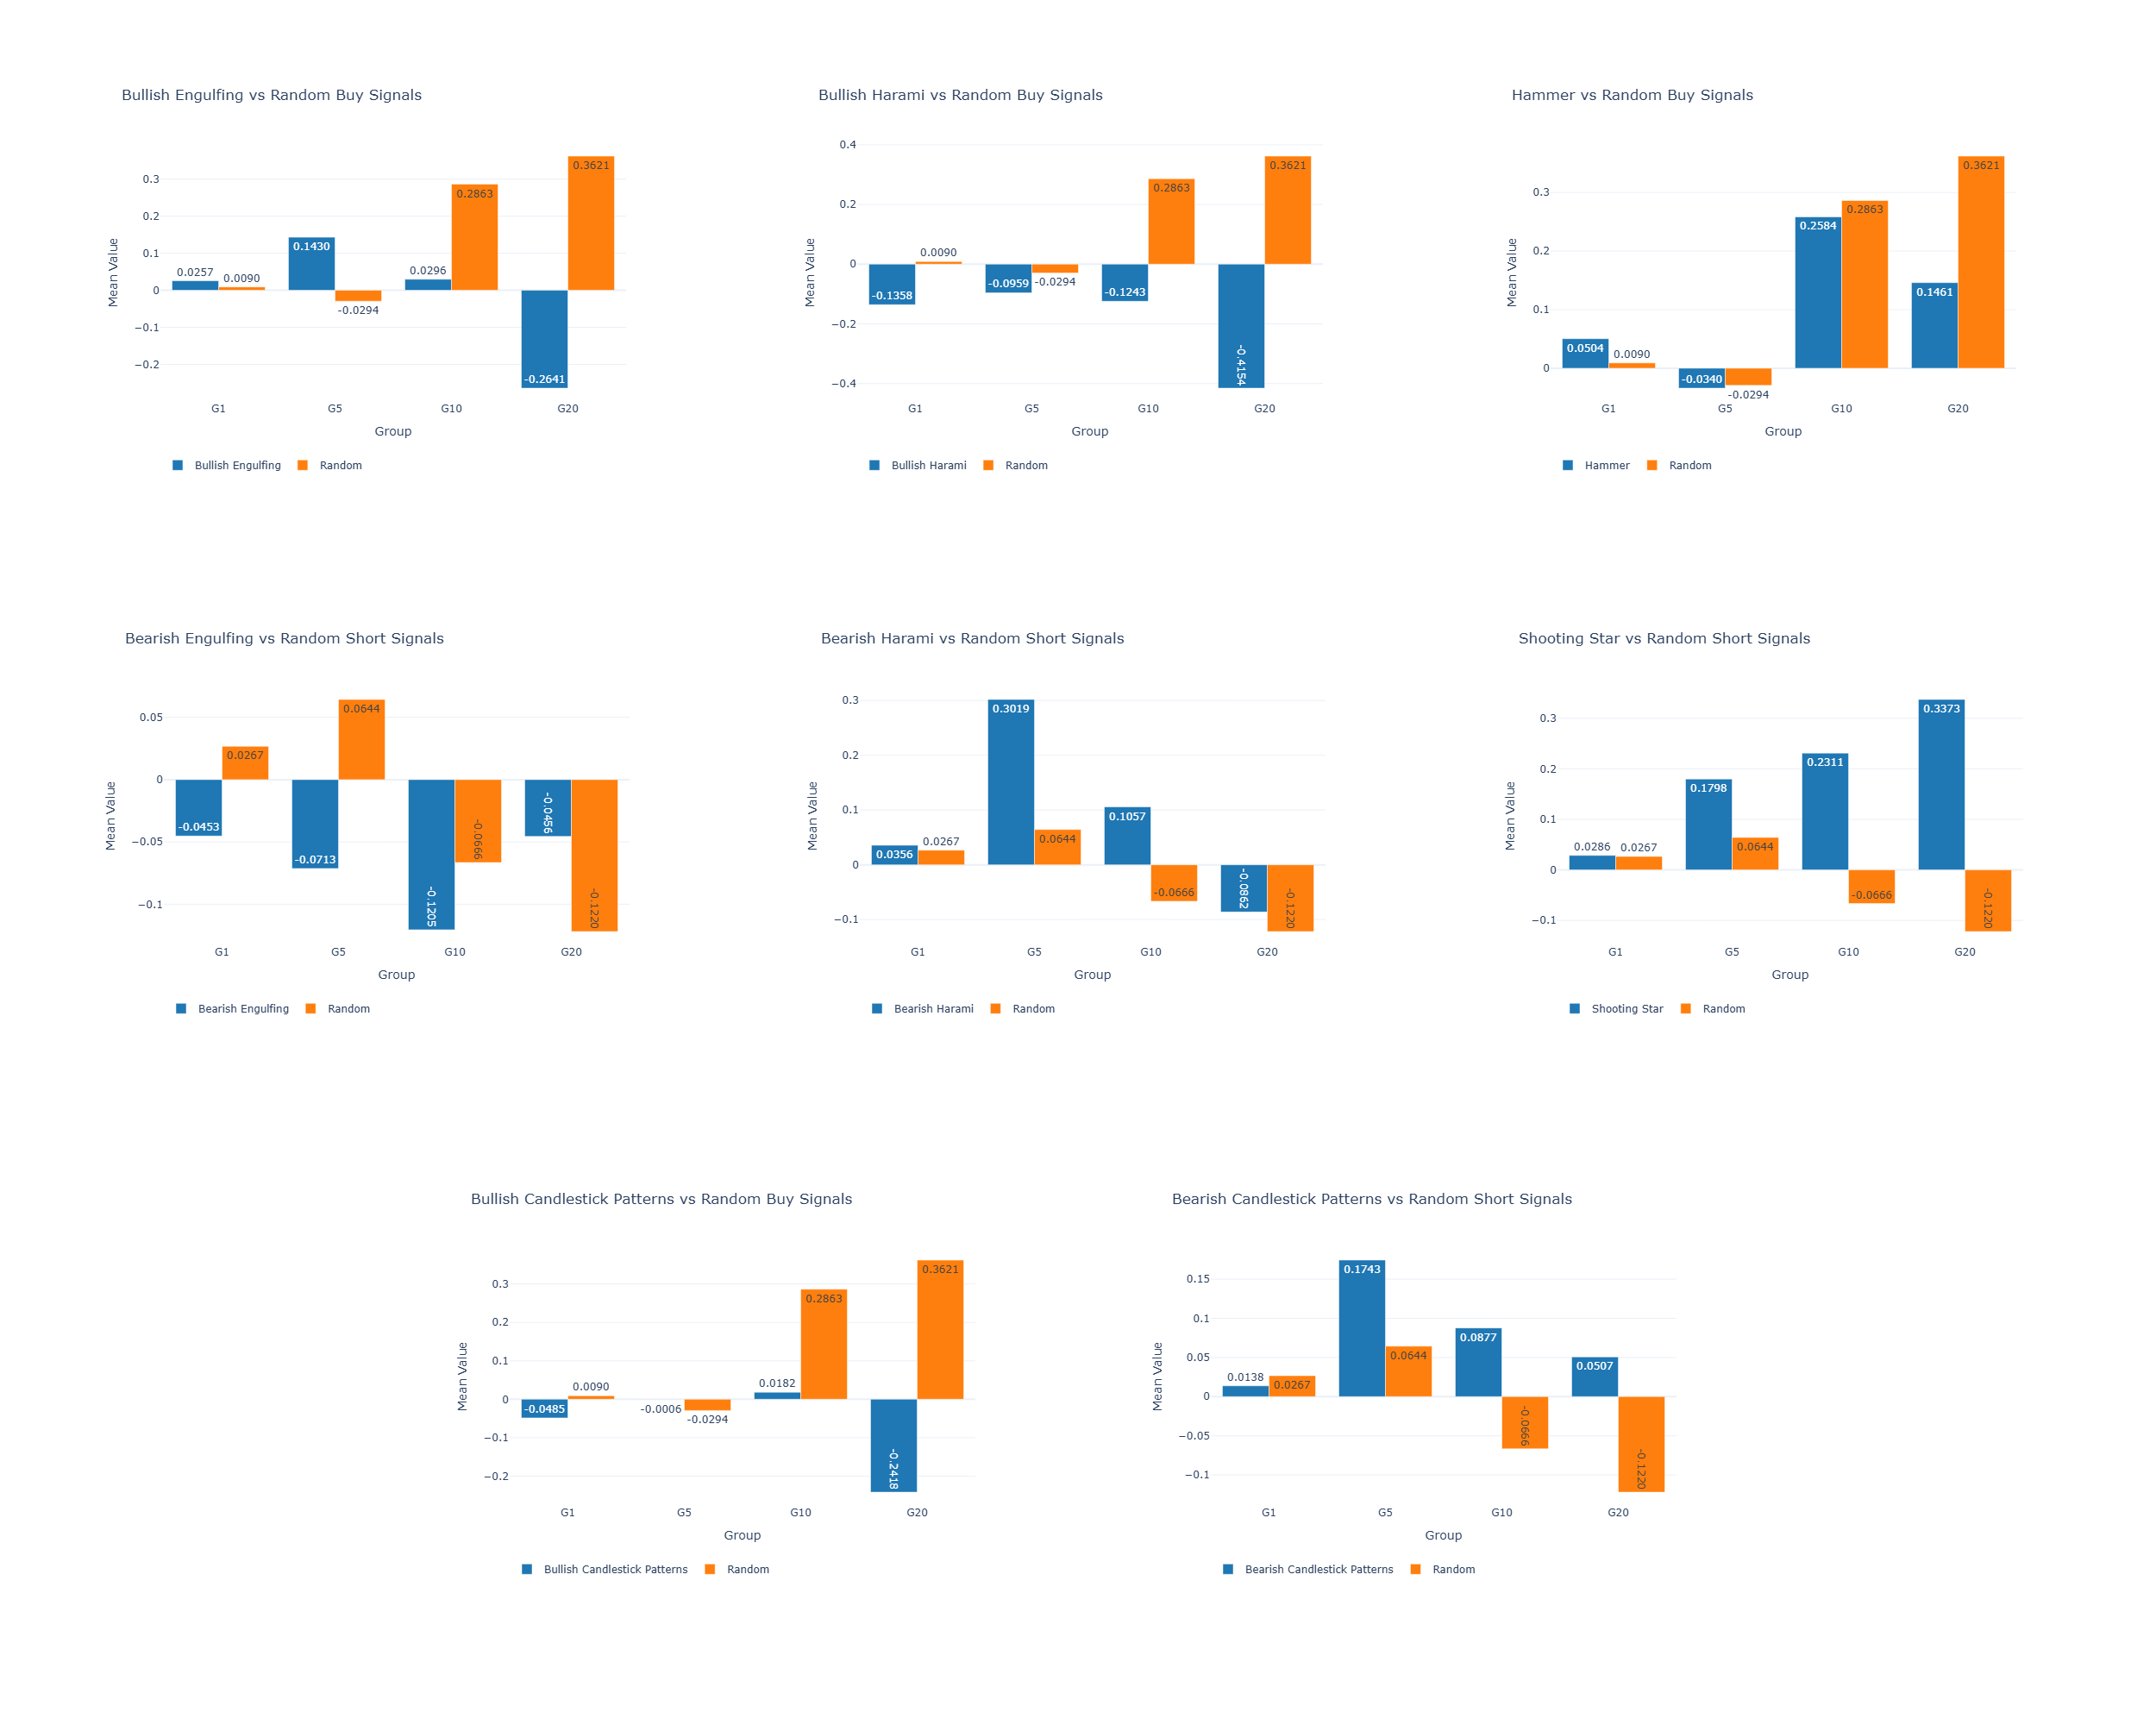
Figure 3: Mean Percentage Returns of Candlestick Patterns vs Random Signals, using Bollinger bands as support and resistance
Using horizontal levels
| G1 | G5 | G10 | G20 | ||
| Bullish Engulfing S = 220 | Candlestick Pattern | -0.0537 | -0.0809 | -0.0828 | -0.1591 |
| Random Signal | -0.0348 | -0.0114 | -0.0034 | -0.0593 | |
| Bullish Harami S = 214 | Candlestick Pattern | -0.0983 | -0.0353 | -0.0013 | -0.1915 |
| Random Signal | -0.0348 | -0.0114 | -0.0034 | -0.0593 | |
| Hammer S = 99 | Candlestick Pattern | -0.0074 | -0.0686 | -0.0526 | -0.3016 |
| Random Signal | -0.0348 | -0.0114 | -0.0034 | -0.0593 | |
| Bearish Engulfing S = 213 | Candlestick Pattern | -0.0285 | -0.0413 | 0.0054 | -0.0102 |
| Random Signal | 0.032 | 0.0073 | -0.0603 | 0.009 | |
| Bearish Harami S = 222 | Candlestick Pattern | -0.0136 | 0.0704 | -0.0246 | -0.1915 |
| Random Signal | 0.032 | 0.0073 | -0.0603 | 0.009 | |
| Shooting Star S = 120 | Candlestick Pattern | -0.021 | -0.0499 | 0.1217 | 0.2231 |
| Random Signal | 0.032 | 0.0073 | -0.0603 | 0.009 | |
| Bullish Patterns S = 529 | Candlestick Pattern | -0.0673 | -0.0648 | -0.0543 | -0.2233 |
| Random Signal | -0.0348 | -0.0114 | -0.0034 | -0.0593 | |
| Bearish Patterns S = 548 | Candlestick Pattern | -0.0197 | 0.0022 | 0.0211 | -0.0091 |
| Random Signal | 0.032 | 0.0073 | -0.0603 | 0.009 |
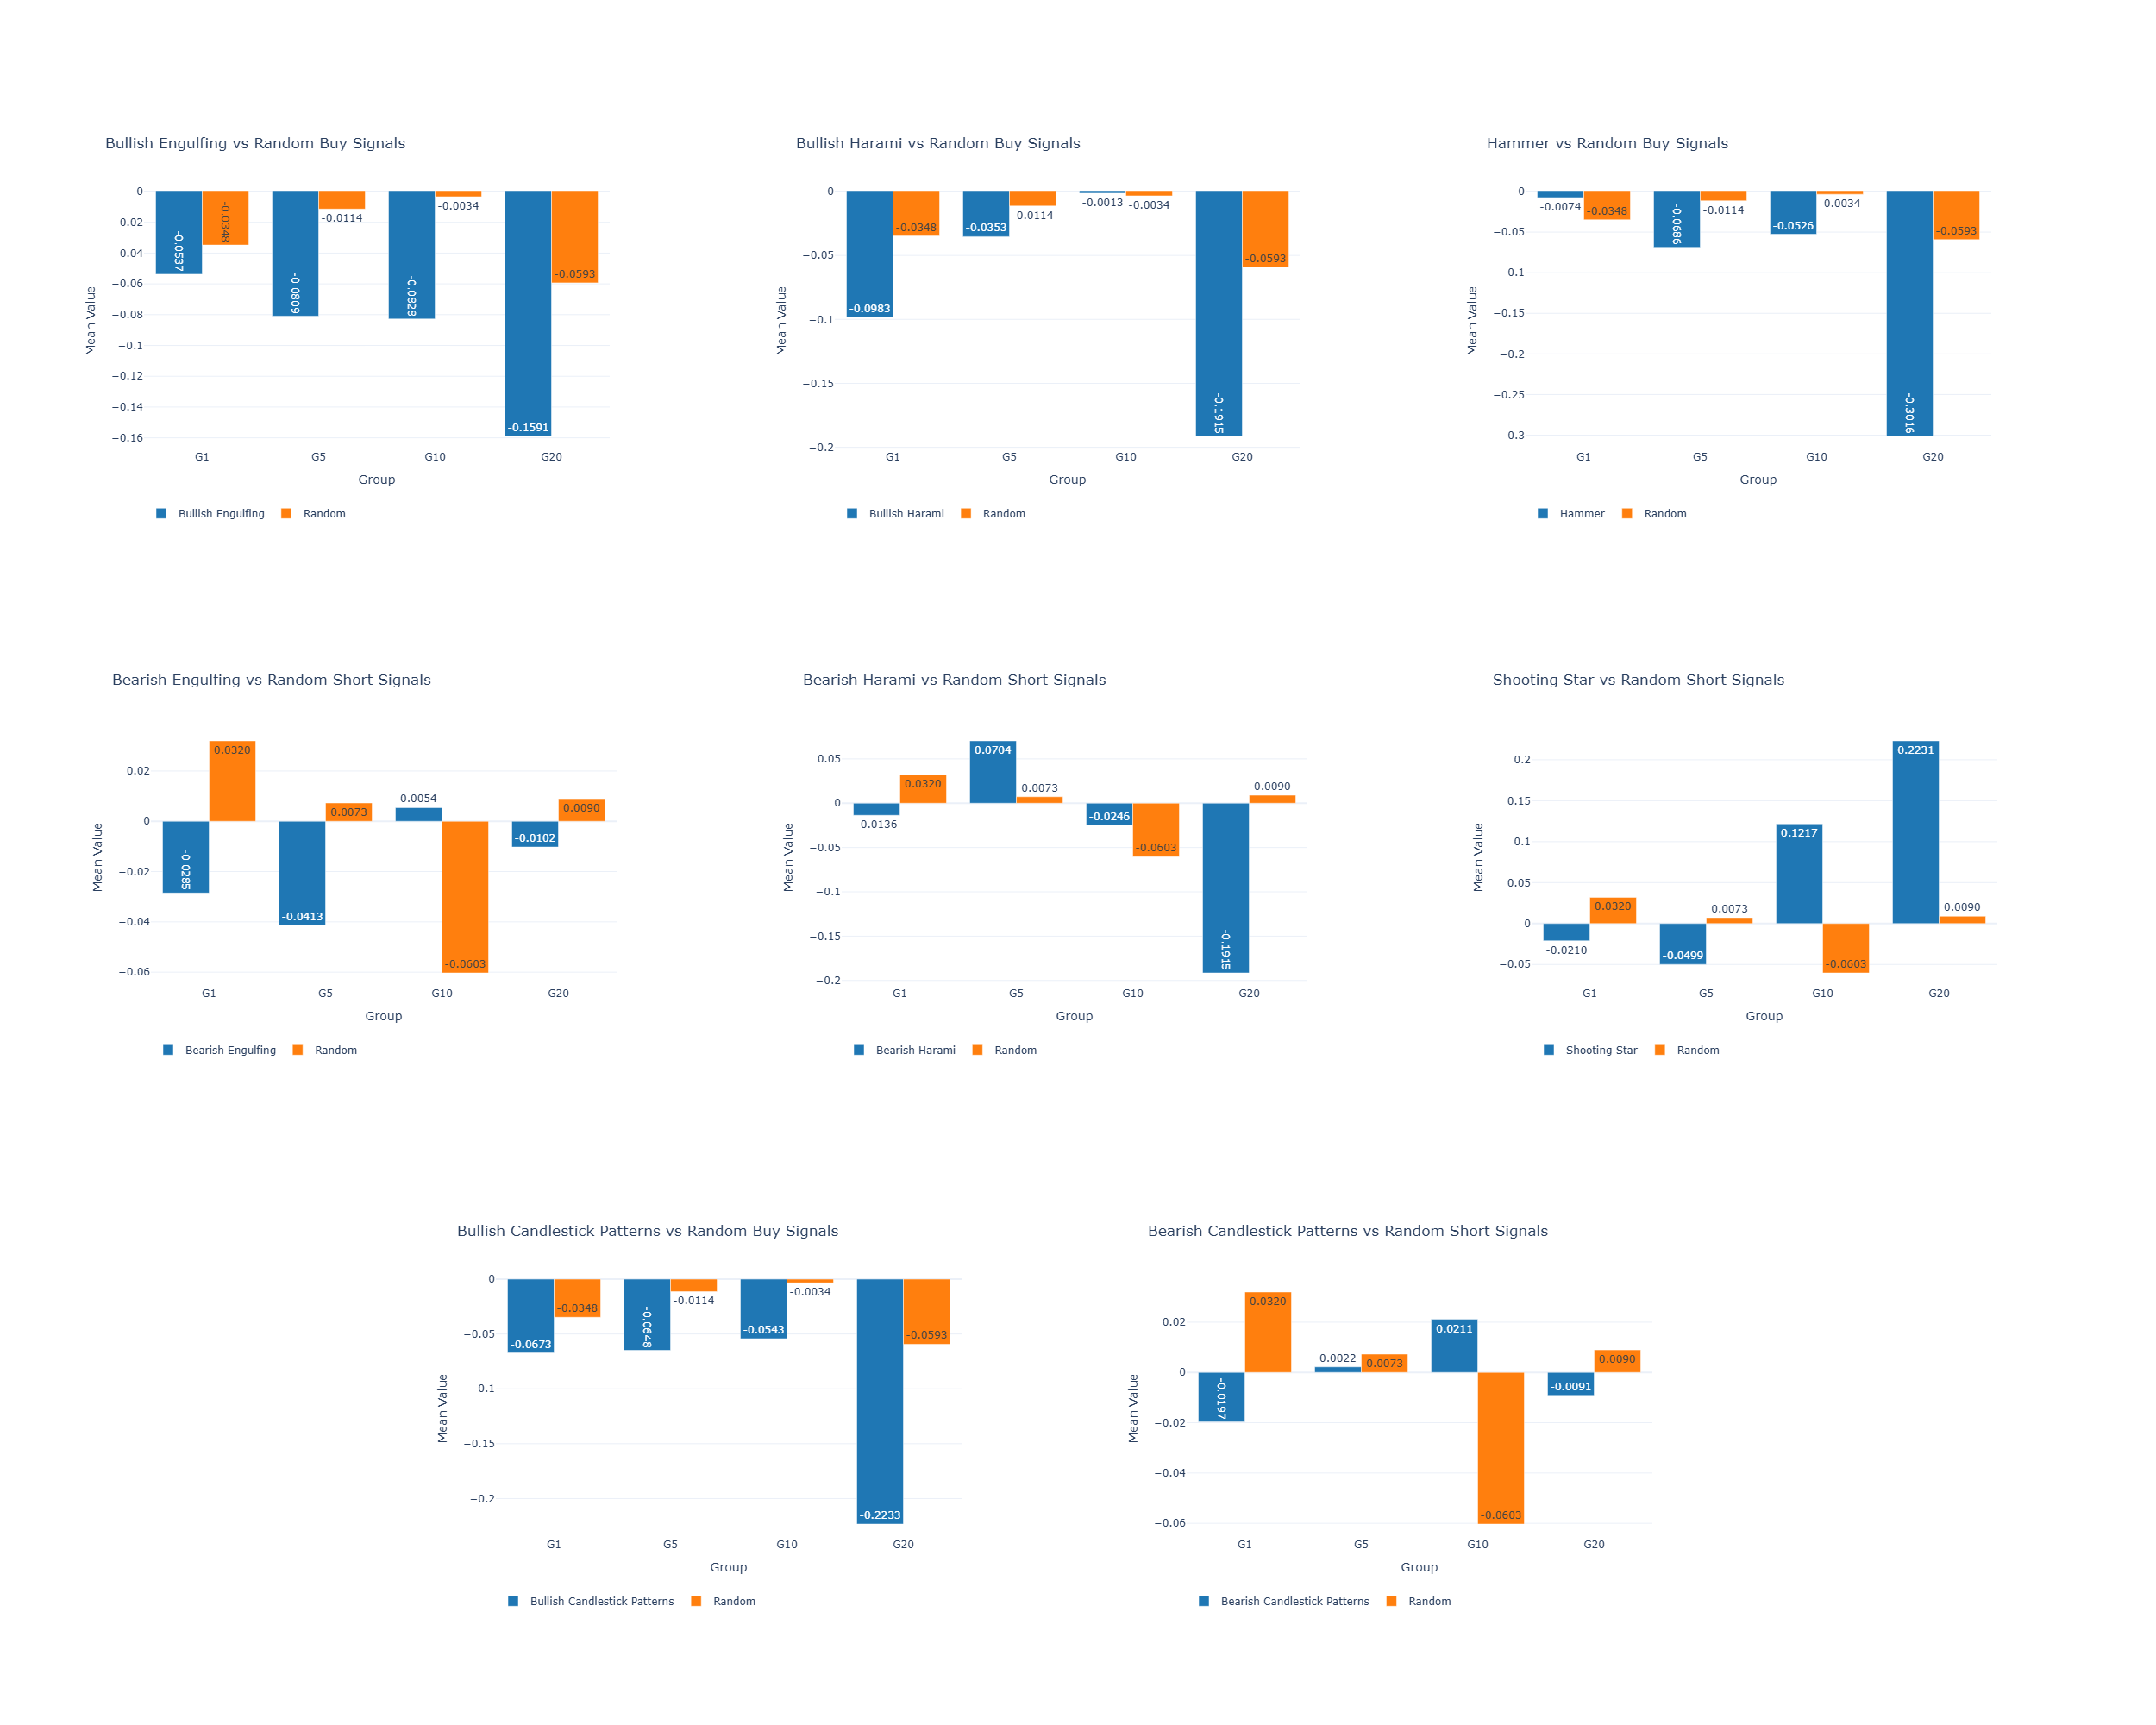
Figure 4: Mean Percentage Returns of Candlestick Patterns vs Random Signals, using horizontal levels as support and resistance
Using pivot points
| G1 | G5 | G10 | G20 | ||
| Bullish Engulfing S = 230 | Candlestick Pattern | -0.0717 | -0.0712 | -0.0313 | -0.0921 |
| Random Signal | -0.0406 | -0.0172 | -0.012 | -0.0329 | |
| Bullish Harami S = 219 | Candlestick Pattern | -0.0709 | 0.0005 | 0.0395 | -0.2118 |
| Random Signal | -0.0406 | -0.0172 | -0.012 | -0.0329 | |
| Hammer S = 89 | Candlestick Pattern | 0.0077 | 0.1052 | 0.0457 | -0.3923 |
| Random Signal | -0.0406 | -0.0172 | -0.012 | -0.0329 | |
| Bearish Engulfing S = 231 | Candlestick Pattern | -0.0151 | -0.0049 | 0.0453 | 0.0939 |
| Random Signal | 0.0198 | 0.0079 | -0.0668 | -0.0245 | |
| Bearish Harami S = 235 | Candlestick Pattern | -0.0155 | 0.1022 | 0.0247 | -0.1667 |
| Random Signal | 0.0198 | 0.0079 | -0.0668 | -0.0245 | |
| Shooting Star S = 117 | Candlestick Pattern | -0.0107 | -0.0032 | 0.0537 | 0.343 |
| Random Signal | 0.0198 | 0.0079 | -0.0668 | -0.0245 | |
| Bullish Patterns S = 535 | Candlestick Pattern | -0.061 | -0.0108 | 0.0049 | -0.2051 |
| Random Signal | -0.0406 | -0.0172 | -0.012 | -0.0329 | |
| Bearish Patterns S = 580 | Candlestick Pattern | -0.0139 | 0.0408 | 0.0456 | 0.0546 |
| Random Signal | 0.0198 | 0.0079 | -0.0668 | -0.0245 |
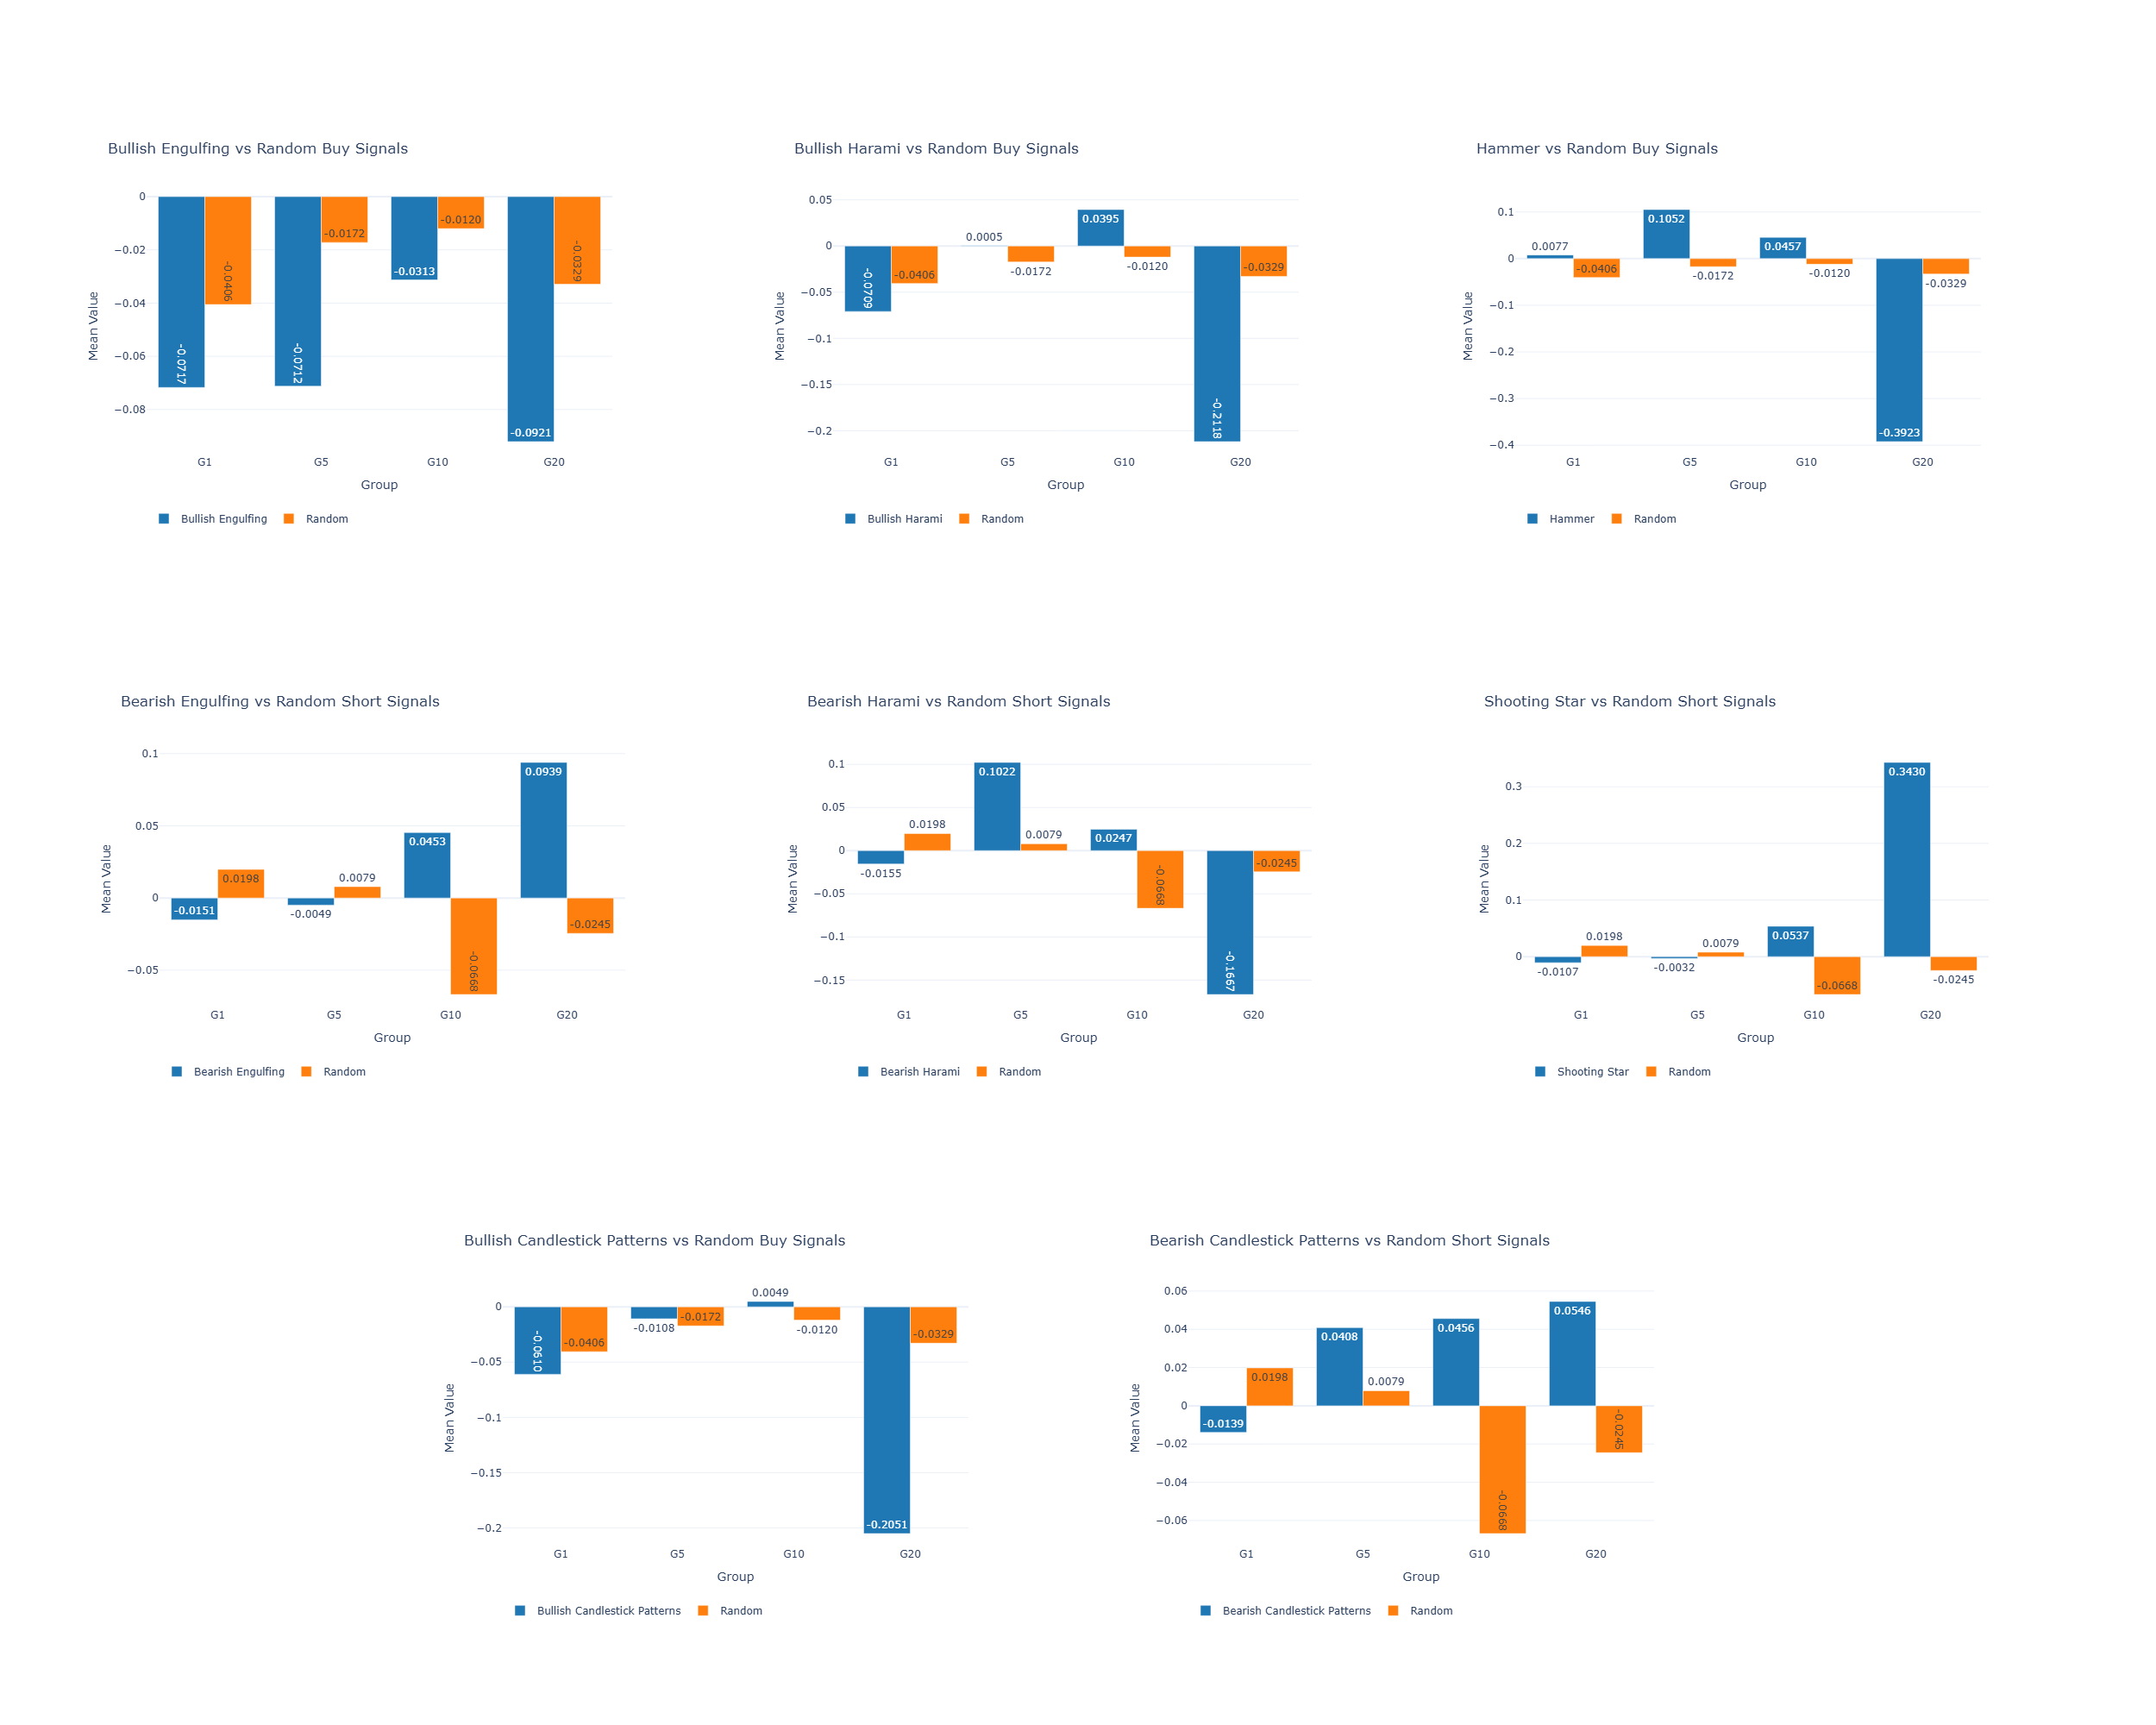
Figure 5: Mean Percentage Returns of Candlestick Patterns vs Random Signals, using pivot points as support and resistance
Discussion
Unfortunately, the results are not very promising.
With reference to figures 3 to 5 above, we want the blue bars (mean percentage returns for candlestick patterns) to be above the horizontal axis and longer than the orange bars (mean percentage returns for random signals). Unfortunately, that is not the case for most of the charts.
In some cases, we have the blue bars longer than the orange bars, but both of them are below the horizontal axis. This means that both the candlestick pattern and random signals gave negative returns. The blue bars being longer than the orange bars in the negative territory (e.g. Figure 5 top-left corner chart) means that the candlestick pattern produced a worse negative result than random signals. This means we are better off just randomly entering a trade instead of using candlestick patterns for entry. Unfortunately, we do see quite a few charts where the blue bar is in the negative zone and is longer than the orange bar.
Out of the six candlestick patterns, the shooting star pattern appears to be the most promising. Regardless of whether we use pivot points, horizontal levels or Bollinger bands to identify support and resistance, the shooting star candlestick pattern outperforms random signals, especially when the gain is computed after a longer timeframe, such as 10 days (G10) or 20 days (G20). However, note that this difference is not statistically significant, whether tested using a t-test, mann-whitney test, or bootstrap test.
For each of the figures, the two charts in the last row is a summary of all three bullish and bearish signals, respectively. This summary provides a clear overview that bearish signals appear to work better than positive signals, regardless of which support and resistance technique we use. Once again, note that these differences are not statistically significant.
Problems when testing if candlestick patterns work in Forex
One of the problems when trying to test if candlestick patterns work in Forex is that a lot of discretion is necessary when defining the candlestick patterns.
For instance, when defining the bullish engulfing candlestick pattern, one of the criteria is that the candle’s real body must be at least one ATR.
The reason is that a bullish engulfing candle should demonstrate conviction. A candle with a small body, such as a doji in the extreme case (where open = close), represents hesitation and indecision on both the bull’s and bear’s end.
A green large real body on the other hand, such as one with a height of at least one ATR, demonstrate strength and conviction on the bull’s part.
While this criterion makes sense, its parameters are arbitrary. Why do we use one ATR instead of 1.5 ATR? Why do we just look at the real body and ignore the wick?
Changing any of the criteria can lead to changes in the results. Given the large number of criteria used to define all the patterns, we have endless possible combinations, which can lead to vastly different results.
This problem with arbitrary definitions is compounded by the fact that the number of trade signals is low.
For instance, if we use pivot points as support and resistance, considering all 7 Forex pairs, we only have a total of 535 bullish and 580 bearish signals. That works out to only about 4.5 trades per year per symbol.
Changing the pattern definition slightly can lead to a totally different set of trades taken each year. For instance, one definition may lead to trades taken on days 5, 154, 201 and 219, while another definition can lead to trades taken on days 12, 140, 199 and 290.
If we have a larger sample of trades, changing the definition will likely result in a reasonable overlap in the trade signals, which will result in more robust results.
Conclusions
This study did not demonstrate that candlestick patterns work in Forex.
- Firstly, none of the categories have average gains that are statistically better than random signals. In fact, quite a few of the categories have results where the candlestick patterns perform worse than random.
- In general, bearish signals seem to perform better than bullish signals, regardless of whether we use Bollinger bands, horizontal levels or pivot points as support and resistance.
- The strongest pattern appears to be the shooting star candlestick pattern. However, as mentioned above, this difference is not statistically significant.
As such, I would caution against using these patterns to trade.
However, I will also hesitate to conclude that they do not work.
Rather, it is possible that candlestick patterns are more suited for discretionary trading, where experience and intuition can guide the trader in identifying a candlestick pattern instead of relying on rigid rules and definition. For instance, a trader can easily spot a bullish engulfing candlestick pattern without having to check if its real body is at least one ATR.
Perhaps future research will reveal better ways to define each pattern systematically, or we may find that candlestick patterns are very useful in signalling an exit (instead of an entry).
For instance, a shooting star pattern may not give us sufficient reason to take a new short position, but can be a valid signal to exit an existing long position, or to at least take partial profits.
Leave a Reply